Customer feedback analysis works best when you start from one decision, then log where each piece of feedback came from, who gave it and what they were asked. Count themes inside each source first. Compare directions across reviews, surveys, polls and support emails second. Then make the one decision the combined evidence can support, and list what still needs checking.
That is the whole method. The rest of this guide shows you how to do each step with a spreadsheet and an hour or two a month.
Most small businesses already collect plenty of feedback. Reviews arrive on Google and Facebook. A survey goes out after each job. Someone runs a poll in an Instagram story. Support emails pile up in a shared inbox. The trouble is not a shortage of opinions. The trouble is that each one answers a different question, from a different group of people, in a different unit.
People often call this combined picture the voice of the customer. It is a useful phrase, as long as you remember that the voice comes through several channels, and each channel bends it a little.
Pooled feedback gives you the wrong answer.
The most common mistake is to copy every comment into one sheet, tag it and count the tags. It feels thorough. It quietly mixes things that should never be added together.
Think about what each record is.
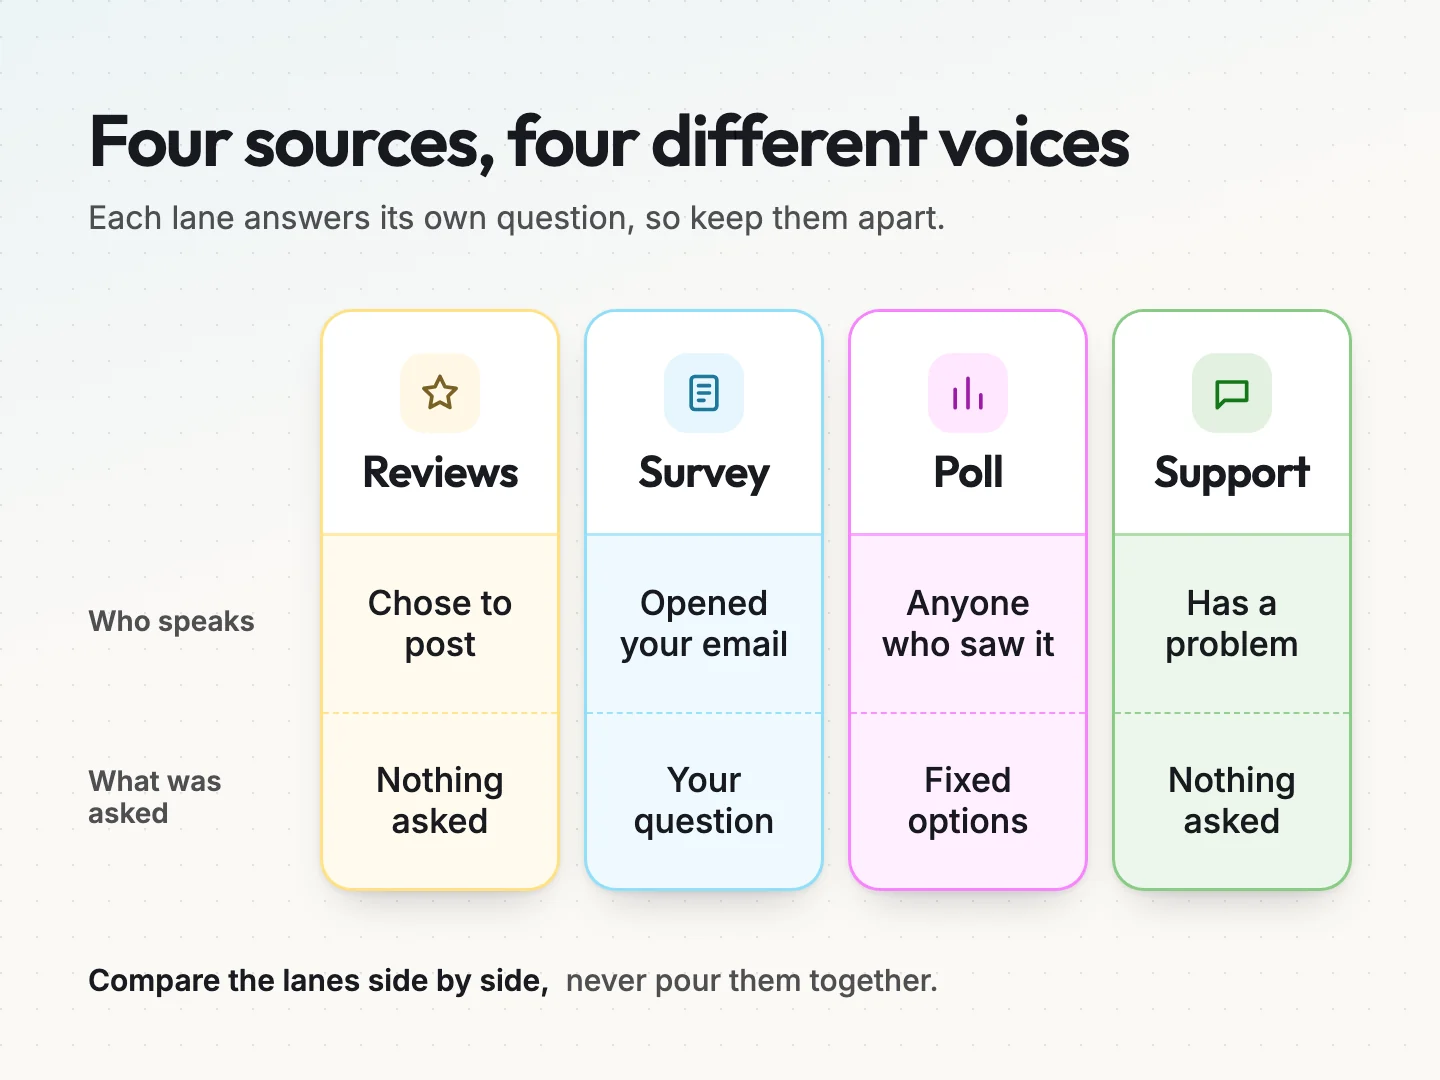
A Google review is something a customer chose to write, usually after a great or a poor visit. A survey answer is a response to a question you wrote, from someone who opened your email. A poll vote is a single tap from whoever saw your story that day, customer or not. A support email is a person with a problem right now.
When you pool them, three kinds of context disappear.
- The population. Who could have answered, and who chose to.
- The question. What, if anything, the person was asked.
- The unit. Whether one row means one person, one visit, one vote or one message.
Lose those three and your totals stop meaning anything. Ten complaints about parking might be ten people, or one person who emailed four times and left a review. A poll where most voters wanted Saturday hours might be mostly followers who have never bought from you.
Pooling also hides disagreement. If reviews praise your staff while survey comments complain about wait times, those are two separate findings. Averaged together, they look like a mild middle that nobody said.
Keeping sources separate does not mean ignoring the overlap. It means you compare sources the way you would compare witnesses. Each one saw part of the event from a different spot. Agreement between them is strong evidence. Disagreement is a clue worth following.
Start with the one decision your feedback must support.
Before you open a single review, write down the decision you need to make. Feedback analysis without a decision tends to end in a slide full of themes and no change.
A good decision question is specific and changeable. Compare these three.
- “What do customers think of us?” This is too broad to act on.
- “Should we send an arrival text before each visit?” You can act on this one.
- “Should we change how we explain pricing on the booking page?” You can act on this too.
Once you have the decision, write two more lines under it. First, what would you do differently if the answer were yes? Second, what is the cheapest way to test it? Those lines keep the analysis honest. They also tell you which sources matter and which you can skip this round.
It helps to know who you are deciding for. If you have not described your main customer groups yet, the customer persona worksheet gives you a simple way to write them down before you start sorting feedback by group.
Keep the scope small on purpose.
One decision per round is enough for most small teams. You can run another round next month. Trying to answer five questions from the same pile usually means none of them gets a proper look, and the strongest opinions win by default.
Each feedback source tells you something different.
Every feedback channel has a built-in tilt. That tilt is not a flaw. It is information about how to read the source. Here is how the common small business sources behave.
Online reviews
Reviews are written by people who chose to post, often after a memorable experience. Nobody asked them a specific question, so they talk about whatever stood out. That makes reviews good for spotting themes you did not think to ask about. It makes them weak for estimating how common anything is across all your customers.
How you ask for reviews changes the pile too. If you only invite customers you expect to be happy, your reviews will lean positive and stop telling you about problems.
The FTC’s Consumer Reviews and Testimonials Rule questions and answers, published in November 2024, says the rule has no specific ban on asking only happy customers. It adds that the practice could still break the wider FTC Act. This is not legal advice, so check with your own advisor.
For analysis, the takeaway is practical. Ask everyone, the same way, at the same point in the job. A setup like an automatic review request after every job makes that easy to keep consistent.
Survey answers
A survey answer responds to a question you wrote. That gives you control and comparability. You can ask every customer the same thing and count the answers. The tilt comes from who opens and finishes the survey, and from how you worded the question. Leading wording, such as “How much did you enjoy your visit?”, pushes answers one way.
Rating questions tell you how many. The open comment box tells you why. Keep both, and keep them linked to the same response.
Polls
A social poll is fast and cheap, but it is the loosest source on this list. Anyone who sees the post can vote, including people who have never bought from you. The choices are limited to the options you offered. One vote is one tap, with no reason attached.
Polls are useful for a quick read on preference between options you are already willing to offer. They are a poor guide to what customers need, because they cannot surface an option you did not list.
Support emails, calls and chat
Support messages come from people with a live problem. They are honest and specific, and they arrive without you asking. They also over-represent whatever is currently broken, and one frustrated customer can send several messages about the same issue.
Count support feedback by person or by case, not by message. Otherwise one long thread looks like a trend.
Conversations and interviews
Short conversations with customers give you depth that no other source can. You hear the words people use and the reasons behind their choices. The sample is tiny, so treat interviews as a way to explain a pattern, not to measure it. If you want a set of questions to start with, see our guide to using the customer persona worksheet.
The source scope worksheet you can copy today.
The source scope worksheet is the core tool in this method. It is one small table that records the context of each source before you read a single comment. You fill in one row per source, not one row per comment.
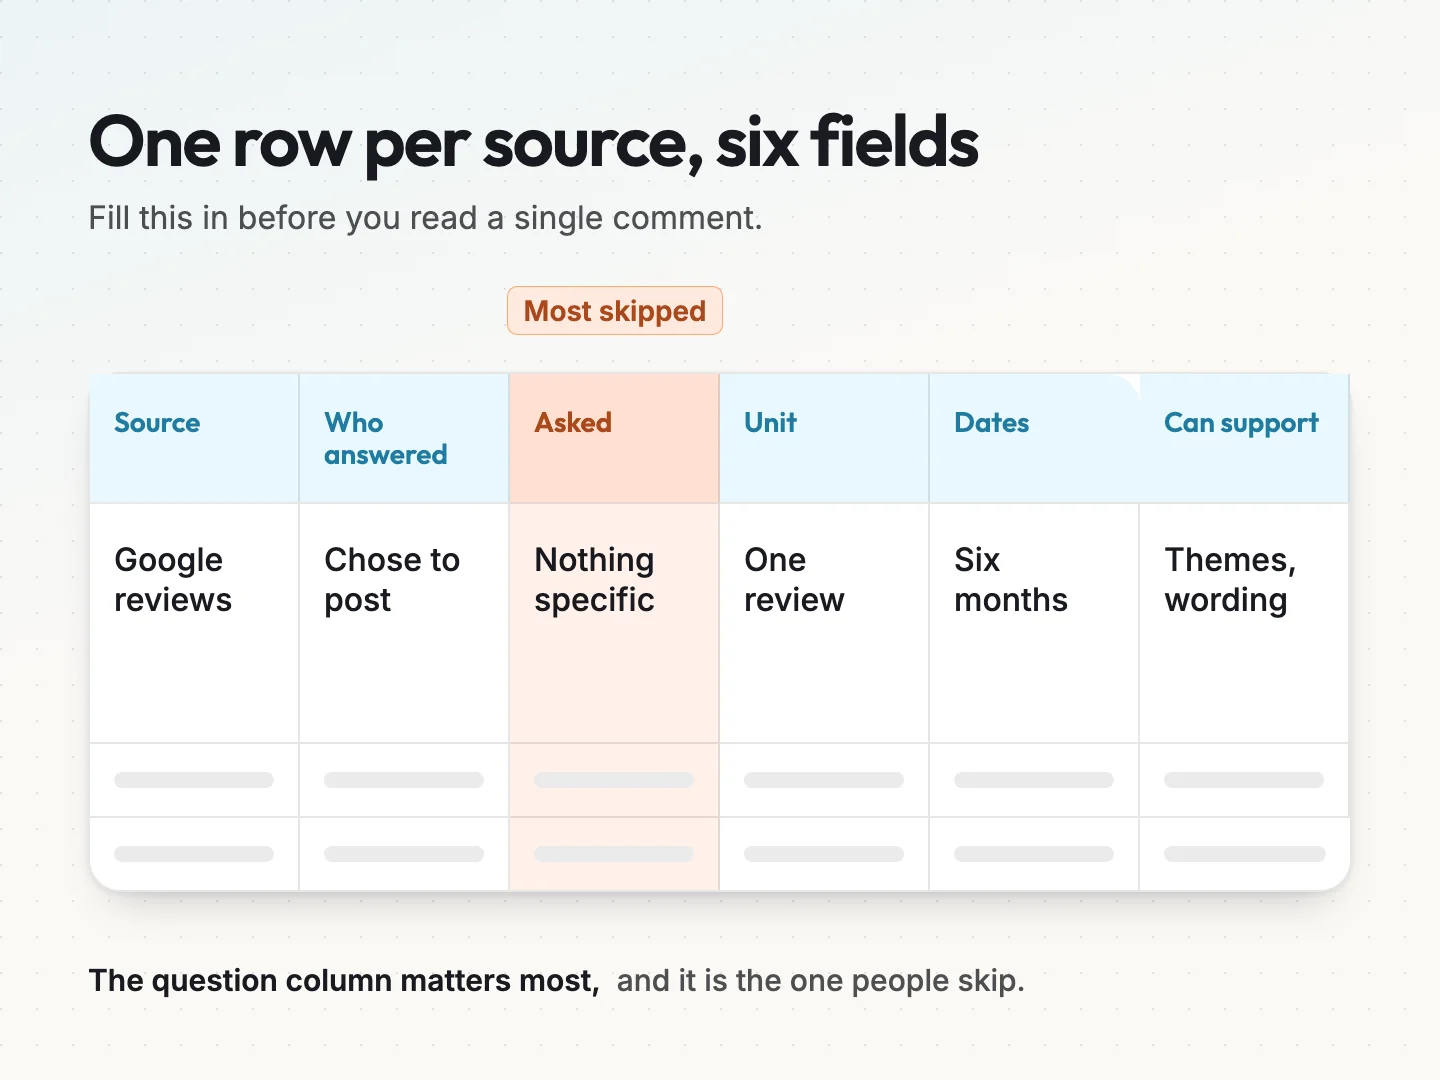
Copy this table into any spreadsheet. The first row is filled in as a hypothetical example so you can see the level of detail.
| Source | Who answered | What they were asked | Unit | Date range | Can support |
|---|---|---|---|---|---|
| Google reviews (hypothetical) | Customers who chose to post | Nothing specific | One review | Last six months | Themes, wording, problems we missed |
| Post-visit survey | |||||
| Instagram poll | |||||
| Support inbox | |||||
| Customer calls |
Here is what each column means and how to fill it in.
- Source. Name the channel and the place. “Google reviews” is better than “reviews” if you also have Facebook reviews.
- Who answered. Describe the people who could respond and the ones who did. “Customers who opened the follow-up email” is a different group from “everyone who follows our page”.
- What they were asked. Paste the exact question, or write “nothing specific” for unprompted feedback. This column is the one people skip most often, and it matters most.
- Unit. Say what one record stands for. One review, one survey response, one vote, one support case or one call.
- Date range. Note the period the records cover. Feedback from before a change you made should not count against the new process.
- Can support. Write the kinds of conclusion this source can carry. A poll can support “followers prefer option A over option B”. It cannot support “most customers want option A”.
Add two optional columns if they help. A count column holds how many records the source has. A known tilt column records anything that bends the sample, such as a survey sent only to repeat customers.
Fill in the worksheet before you code any comments. It takes ten minutes and saves you from the most common errors later. It also gives anyone reading your findings a quick way to see how much weight each source deserves.
Code each comment without losing where it came from.
Coding means reading each comment and tagging it with one or more short themes, such as “arrival time”, “price clarity” or “staff friendliness”. It turns loose text into something you can count.
Set up your coding sheet with one row per record. Keep these columns on every row.
- Source, matching a row in your scope worksheet.
- Record ID, such as the review date and first name, or the survey response number.
- Person or case, so you can spot several records from one customer.
- Exact words, pasted in full, never paraphrased.
- Themes, one or more tags.
- Tone, marked positive, negative or mixed.
Start with a short list of themes from your decision question. Add new ones as you read, but keep the list under about a dozen. Too many themes and every count becomes one or two.
Let a comment carry more than one theme. “The crew was lovely but showed up an hour late” is both “staff friendliness” positive and “arrival time” negative. Forcing it into one bucket loses half the message.
Keep the exact words. When you share findings later, a real quote from a customer explains a theme far better than your label. Quotes can also feed your marketing, with permission. Our guide to publishing customer reviews responsibly covers how to ask for that properly.
A note on AI tools
AI tools can suggest themes and tag a large pile of comments quickly. They are a reasonable first pass. Check a sample of their tags by hand, and keep the source and unit columns yourself. A tool that pools everything into one summary repeats the exact mistake this method is built to avoid.
Count inside each source before you compare sources.
Now you can count, but only inside one source at a time. For each source, work out how many records mention each theme, and how many distinct people or cases that represents.
Write each count as a fraction of its own source. In a hypothetical case, “6 of 23 reviews mention arrival time” is a clear statement. “9 of 41 survey comments mention arrival time” is another one. Each is true about its own group.
What you should not do is add those numbers together. Six reviews plus nine survey comments plus a few support cases does not make a total that describes anything. The groups overlap in unknown ways, and the units differ. One person might appear in all three.
Instead, compare direction and strength across sources.
- Does the theme appear in more than one source?
- Is it positive in one and negative in another?
- Is it strongest in the source most likely to reflect your typical customer?
A simple comparison table works well. Put themes in rows and sources in columns, and fill each cell with the within-source fraction. The figures below are hypothetical.
| Theme | Reviews | Survey comments | Support cases |
|---|---|---|---|
| Arrival time | 6 of 23 | 9 of 41 | 5 of 17 |
| Price clarity | 2 of 23 | 4 of 41 | 1 of 17 |
Read across a row. A theme that shows up in every column, from groups with different tilts, is much more likely to be real. A theme that lives in only one source might still be real, but it needs a reason. Maybe that source is the only one that asked about it.
Polls rarely fit in this table, because they measure a choice between fixed options rather than a theme. Report them on their own line, with the exact question and the vote counts.
Decide how much weight each finding can carry.
Not every finding deserves the same confidence. A simple ladder helps you say how far each one can go before you build a decision on it.
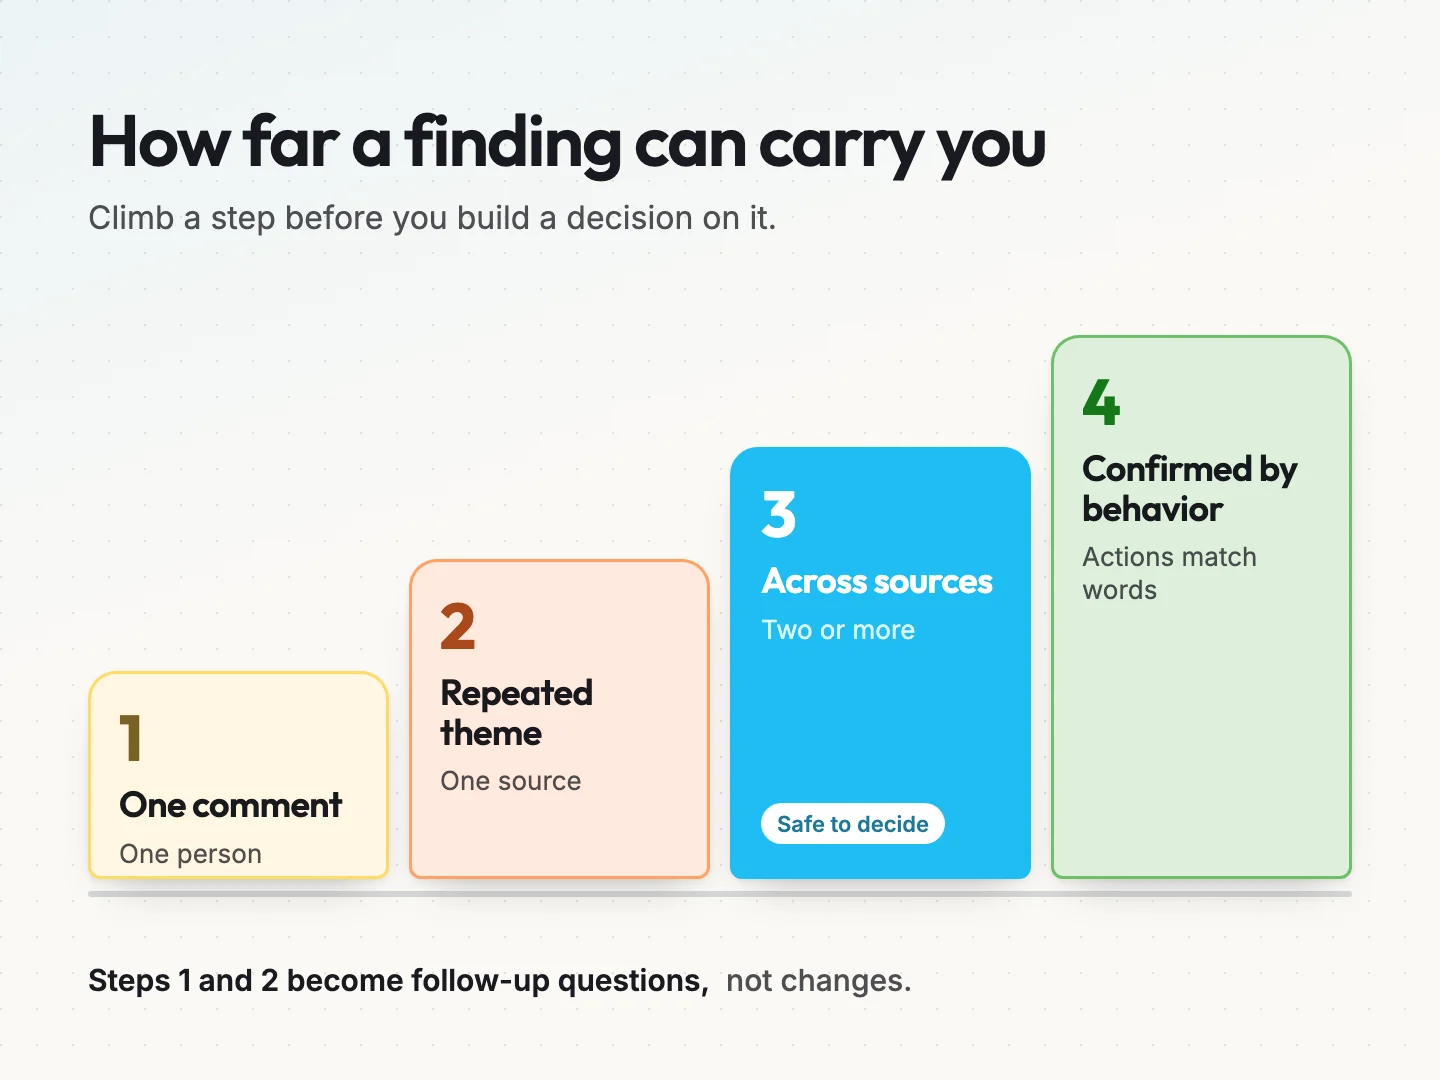
- One comment. A single customer said it. Worth noting, and worth a quick check, but not a basis for change on its own.
- Repeated theme. Several people raised it in one source. Now it is a pattern inside that group.
- Across sources. The same theme appears in two or more sources with different tilts. This is the level where most small decisions are safe to make.
- Confirmed by behavior. What people do matches what they said. Cancellations, repeat bookings, refund requests or clicks back up the comments.
Write the step next to each finding. “Arrival time, step 3, across reviews, survey and support” tells everyone how solid it is. It also tells you what would move it up a step.
A finding stuck at step 1 or 2 is not useless. It becomes a follow-up question. You might add it to your next survey, or ask about it on your next few customer calls.
A worked example from four mixed sources.
Here is a hypothetical example. A small home cleaning company runs two crews. The owner has heard grumbles about crews arriving late, and wonders whether to add Saturday appointments too. The decision for this round is narrow. Should we send an on-the-way text with an arrival window before each visit?
The owner gathers 177 records from four sources and fills in the scope worksheet.
| Source | Who answered | What they were asked | Unit | Count |
|---|---|---|---|---|
| Google reviews | Customers who chose to post | Nothing specific | One review | 23 |
| Post-visit survey | Customers who opened the email | “How was your visit?” plus a comment box | One response | 41 |
| Instagram poll | Anyone who saw the story | “Which would help you most?” with two options | One vote | 96 |
| Support inbox | Customers with a question or problem | Nothing specific | One case | 17 |
Coding inside each source gives these hypothetical counts.
- Reviews. 6 of 23 mention arrival time, and all six are negative.
- Survey comments. 9 of 41 mention arrival time or not knowing when the crew would come.
- Support cases. 5 of 17 cases ask when the crew will arrive on the day.
- Poll. 58 of 96 votes chose “a text when the crew is on the way” over “Saturday appointments”.
Now the comparison. Arrival time appears in three independent sources, each with a different tilt. Reviews lean toward strong experiences. Survey answers come from customers who were asked. Support cases come from customers with a live problem. They point the same way. That puts the finding at step 3 on the ladder.
The poll agrees, but the owner treats it with care. Anyone could vote, and the poll only offered two options. It shows that followers preferred a text over Saturday slots. It does not show that customers want Saturday appointments less, or at all.
Notice what the owner does not do. They do not add 6, 9, 5 and 58 into 78 mentions out of 177 records. That number would mix reviews, responses, cases and taps from overlapping people. It would look precise and mean nothing.
Turn the analysis into one decision and a follow-up list.
The end of each round should fit on half a page. It has three parts: what you decided, what you held back and what you will check next.
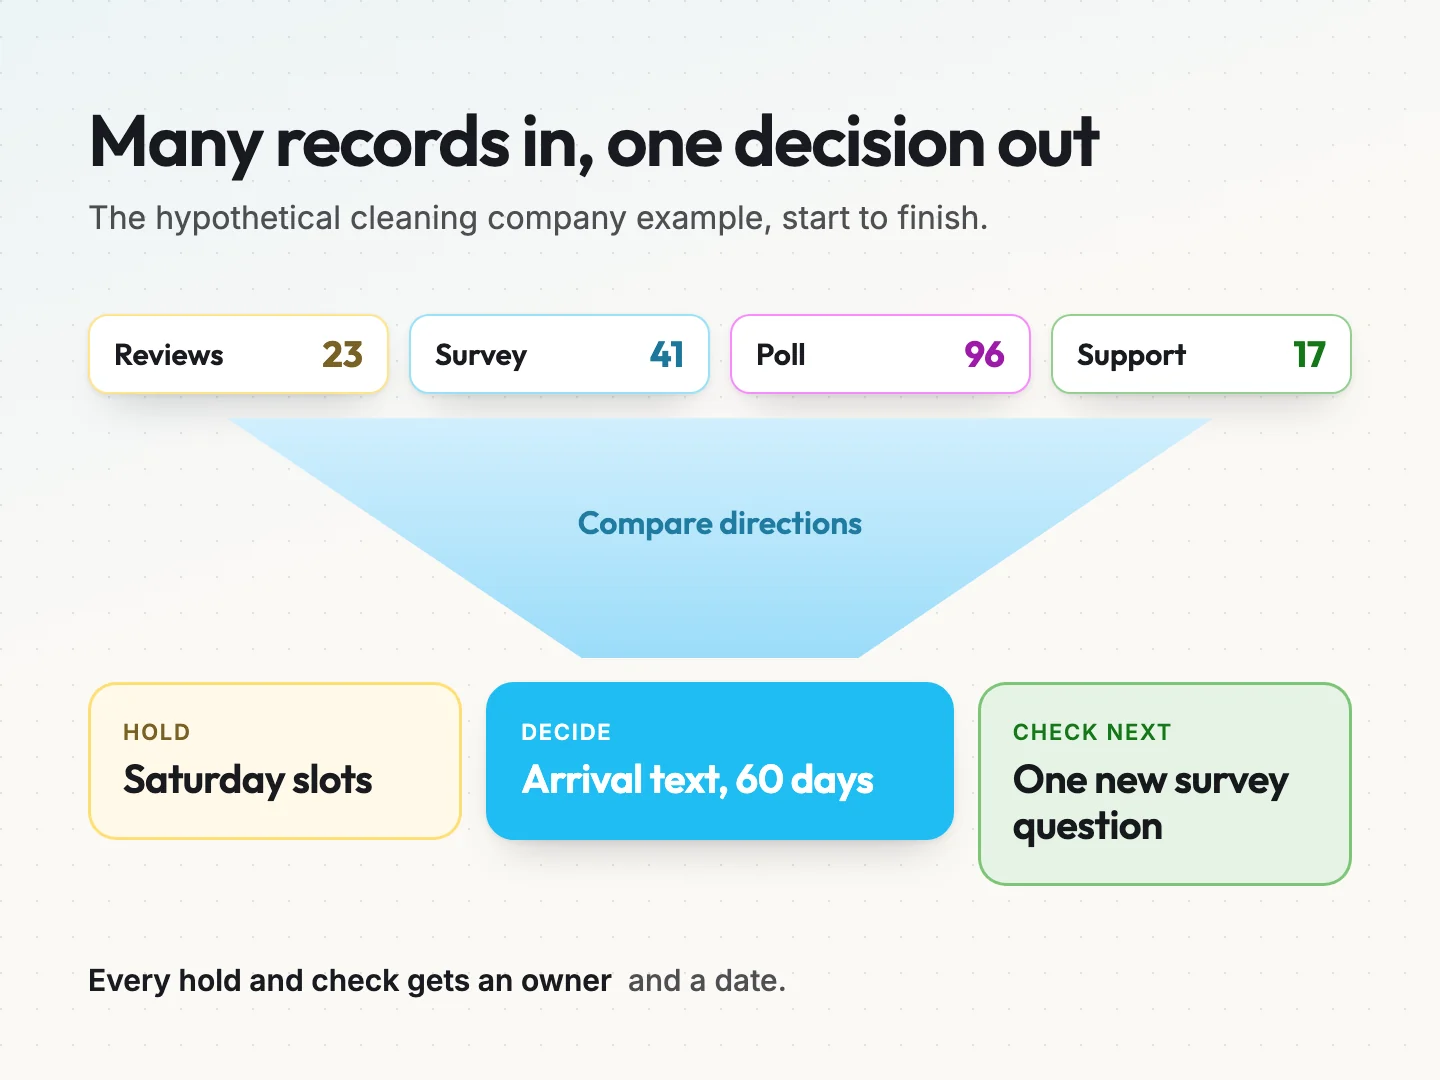
In the hypothetical cleaning company example, the result looks like this.
- Decide. Send an on-the-way text with a one-hour arrival window before every visit for the next 60 days. The finding sits at step 3, and the test is cheap to run and easy to reverse.
- Hold. Saturday appointments. The only support is a two-option poll from an open audience. That is not enough to change crew schedules.
- Check next. Add one survey question: “Did you know when your crew would arrive?” Track how many support cases ask about arrival time over the 60 days. Ask three customers on calls whether they would book on a Saturday.
Each follow-up item has an owner and a date. Without both, the hold becomes permanent by accident, and the next round starts from scratch.
The decision also sets up step 4 on the ladder. If arrival questions in the support inbox drop after the texts start, behavior has confirmed what people said. If they do not drop, the problem may be the arrival times themselves, not the lack of notice. Either way you learn something you can act on.
Share the result in a way people can check.
When you share findings with your team, include the scope worksheet. It lets anyone see where each conclusion came from and how much it rests on. A finding with its source, its fraction and its ladder step is easy to trust or challenge. A finding with only a percentage is not.
Keep feedback analysis running every month.
One round is useful. A steady monthly rhythm is where the value builds, because you can see whether changes worked. Here is a simple routine for a small team.
Weekly, about 15 minutes.
- Copy new reviews, survey answers and support cases into the coding sheet.
- Tag each with themes and tone.
- Flag anything urgent to the right person the same day.
Monthly, about an hour.
- Pick one decision question for the month.
- Update the scope worksheet if any source changed, such as new survey wording.
- Count themes inside each source and fill in the comparison table.
- Place each finding on the ladder.
- Write the decide, hold and check next list, with owners and dates.
Quarterly.
- Look back at past decisions and check whether behavior moved.
- Retire themes nobody mentions any more.
- Review how you ask for feedback, so every customer gets the same invitation.
When you publish reviews on your website, show them honestly. Our resource on publishing customer reviews responsibly covers what to keep in mind before you put feedback in front of new visitors.
If you would like help turning customer feedback into a plan for your marketing and website, our strategy and planning service starts from the same idea. Decide first, then let the evidence show how far you can go.
Common mistakes to watch for
- Counting messages instead of people. One upset customer can look like a trend.
- Treating a poll as a survey. Votes from an open audience do not describe your customers.
- Changing the survey question mid-round. Answers before and after the change are no longer comparable.
- Reading only the negative feedback. Praise tells you what to protect when you change things.
- Skipping the hold list. Without it, weak findings sneak into decisions later.
Final thoughts on customer feedback analysis.
Good customer feedback analysis is less about volume and more about respect for context. Each review, survey answer, poll vote and support case is true about the group and question it came from. Keep that context attached, count inside each source and compare directions across them. You will make fewer, better decisions, and you will know why you made them.
Start small. Fill in the source scope worksheet for the feedback you already have, pick one decision and run one round this month. If you want a second pair of eyes on what your customers are telling you, talk to a specialist and we will help you turn it into a clear next step.
Was this article helpful?